Trying to make sense of the Rockville Centre housing market? Terms like inventory, days on market, and sale-to-list ratio can feel confusing when all you want is a clear path to your next move. You deserve straight talk and practical steps. In this guide, you will learn what each metric means, how to apply it in Rockville Centre, and how to pull reliable local data so you can price, bid, and time your decisions with confidence. Let’s dive in.
What these metrics mean
Inventory and months of supply
Inventory measures how many homes are for sale and how quickly they would sell at the current pace. The common metric is Months of Inventory. Formula: Months of Inventory = Active listings divided by average monthly closed sales. Many people use a 3 or 12 month average to smooth out noise.
How to read it:
- Less than 3 months means a seller’s market with tight supply.
- About 4 to 6 months is balanced.
- More than 6 months means a buyer’s market.
Quick example: If 36 homes sold over the last 3 months, that is 12 per month on average. If there are 18 active listings today, months of supply is 18 divided by 12, which is 1.5 months. That signals strong seller leverage in that segment.
Caveats for Rockville Centre: The village is small, so a few listings can move the needle. Segment by property type, price band, and school zone before you decide what the number means for you.
Days on market explained
Days on Market (DOM) is the time from listing to contract or sale, depending on how it is recorded. Median DOM is usually better than average because a few slow movers can skew the data.
What to watch:
- Relists can reset DOM on public sites. Ask for cumulative DOM when possible.
- DOM varies by price tier and property type, so compare apples to apples.
How to read it:
- Short DOM in the low double digits suggests strong demand and possible multiple offers.
- Longer DOM can mean softer demand or pricing above the market, but strong marketing can still bring quick activity early on.
List-to-sale price ratio
This ratio compares the final sale price to the list price. Calculation: List-to-Sale Ratio = Final sale price divided by final list price, times 100 percent. Some reports use original list price instead of the final list, so be clear about which one you are using.
How to read it:
- Above 100 percent means buyers are paying over list.
- Around 98 to 102 percent shows prices close to list.
- Below 98 percent means sellers are accepting discounts.
Caveats: Price reductions change the story, and different price tiers can show different ratios. Also note that the ratio does not include seller credits or concessions.
How Rockville Centre’s market behaves
Housing stock and property types
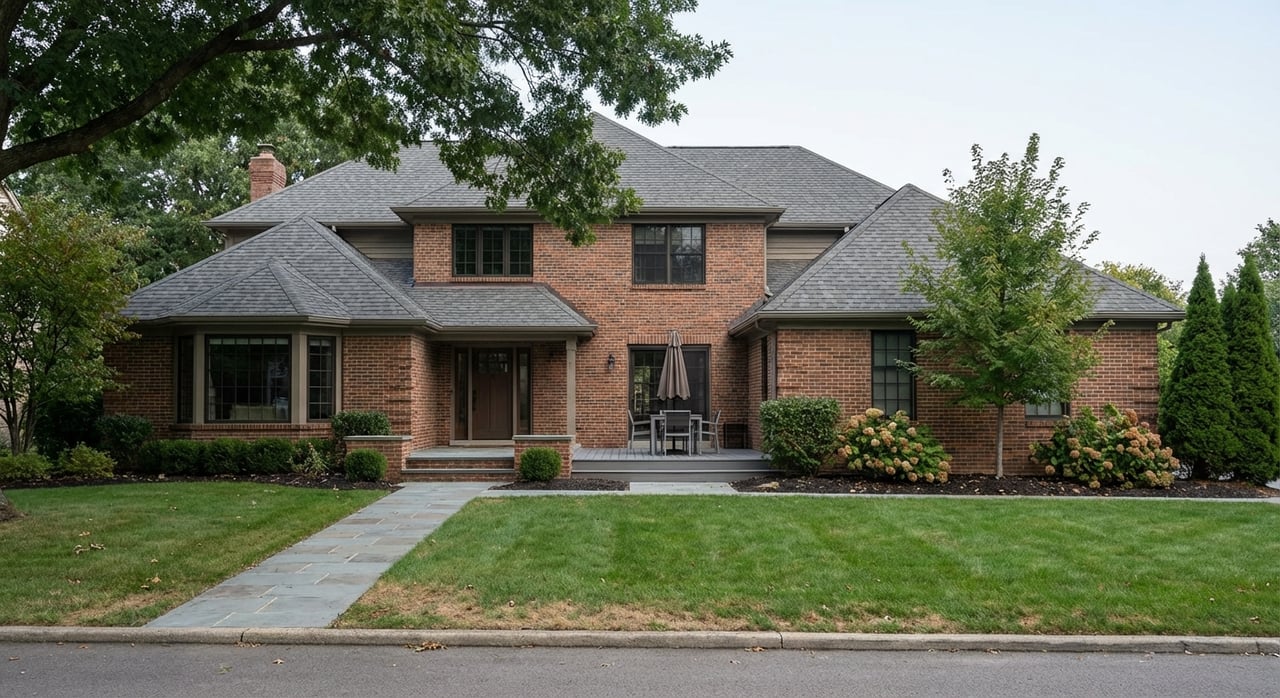
Rockville Centre has a mix of single-family homes, condos, and some multi-family units, often in established neighborhoods with smaller lots. Property taxes are relatively high for Nassau County, and that shapes buyer budgets. Single-family demand often ties to school district boundaries and lot size. Condos respond more to entry-level buyers and investor interest.
Demand drivers to watch
Commuting access to the LIRR and NYC jobs supports demand. Downtown retail, restaurants, and walkability add to desirability. School district boundaries create micro-markets that can change pricing and speed of sale. In some low-lying areas, flood zones and related insurance costs can influence buyer decisions and appraisals.
Seasonality and small-sample swings
Long Island tends to peak in spring for listings and sales, with slower winters. Because Rockville Centre is small, a handful of sales can swing the numbers. Compare year over year for the same month and track a rolling 3 or 12 month view.
Price bands and micro-markets
Segment results by single-family, condo, or multi-family. Then look at entry, middle, and higher price tiers. Finally, check by school zone or nearby street clusters. One quick luxury sale does not set the tone for entry-level buyers.
Read the numbers the smart way
Build comps in Rockville Centre
Use a tight, step-by-step approach so you get meaningful comps:
- Define your subject home: property type, beds and baths, lot size, finished square footage, condition and updates, garage, basement, flood risk, and school zone.
- Pull sold listings from the last 3 to 6 months. Aim for 3 to 6 solid comps in the same property type and school assignment.
- Keep the map tight. For single-family, start within 0.25 to 0.5 miles. For condos, use the same building or complex if possible.
- Adjust for differences. Use local sales to guide dollar or percent adjustments for square footage, beds and baths, condition, and improvements. Note likely direction and range if data is thin.
- Weight the best matches more heavily, prioritizing the most recent and most similar homes.
- Check each comp’s DOM and list-to-sale ratio to gauge the bidding climate when it sold.
Use metrics to time and price
Sellers:
- If months of inventory is low in your segment and DOM is short with list-to-sale ratios at or above 100 percent, a competitive list price can draw strong traffic and possibly multiple offers.
- If inventory is rising, ratios are below 98 percent, and DOM is climbing, price more conservatively or expect a longer time to contract.
- Consider listing early in spring for maximum buyer flow. A winter launch can still work if price and presentation are sharp.
- Weigh carrying costs like taxes and insurance when choosing to wait for a seasonal window.
Buyers:
- In low-inventory, short-DOM segments, get pre-approved, have funds ready for the deposit, and be prepared to move quickly.
- In higher-inventory, longer-DOM segments, you can seek concessions, repairs, or credits and keep protective contingencies where appropriate.
- Use list-to-sale ratios for your exact block or building to plan your offer level or an escalation strategy.
Appraisal and financing realities
Appraisers rely on closed sales, so values can lag when the market is moving fast. Plan for appraisal risk if homes are trading above list. You can structure appraisal contingency language to balance protection and flexibility, and consider options like covering a small gap or renegotiating if needed.
Quick rules of thumb
- If months of inventory for your target property type is 3 or less, expect competition and move fast with a clear offer plan.
- If median DOM is 14 days or less and list-to-sale ratios are at or above 100 percent on final list, prepare for bidding.
- If DOM is above 45 days and ratios are at or below 97 percent, buyers often have more negotiating power.
- Always verify by property type, price tier, and school zone using recent MLS data.
Where to find reliable local data
Primary local sources
- OneKey MLS for Nassau County is the authoritative source for active, pending, and sold data by property type and neighborhood. Local agents can provide custom reports.
- Nassau County property and assessment records provide tax data, lot size, and property attributes.
- The Village of Rockville Centre site and planning department offer zoning details, floodplain maps, and updates on local projects.
- Rockville Centre Union Free School District publishes enrollment information and district details that help you segment comps by assignment zones.
Helpful public sources to cross-check
Consumer-facing market pages can give quick snapshots for median prices, DOM, and active listings. Always verify with MLS because public feeds can lag or differ from local reporting. Local news and real estate blogs can add context on development and policy changes.
Simple data pulls to request
- Active and closed listings by property type and price band for the last 3, 6, and 12 months.
- Monthly months-of-inventory for the past year so you can see seasonality and direction.
- Median DOM by property type and price tier, plus the 90th percentile to understand the spread.
- Sale-to-final-list and sale-to-original-list ratios for the last 3 months and year over year.
- Cumulative DOM when available to control for relist resets.
Example: put it all together
Imagine you are selling a 3 bed, 2 bath single-family home near downtown Rockville Centre. Over the last 3 months, 24 similar homes sold, or 8 per month on average. Today there are 12 active listings in your segment, so months of supply is 12 divided by 8, which is 1.5 months. Median DOM on recent comps is 12 days, and the sale-to-final-list ratio is 101 percent.
What it means: low supply, quick sales, and modest over-list outcomes. A competitive list price with strong presentation could draw multiple offers. If you are a buyer targeting the same segment, expect speed. Arrive pre-approved, review recent comps, and decide in advance how high you are comfortable going if an escalation is needed.
Checklist for early-stage researchers
- Ask an agent to export recent solds and active listings from OneKey MLS for your property type and price band.
- Compute months of inventory and median DOM for the last 3 and 12 months.
- Calculate sale-to-final-list and sale-to-original-list ratios for the last 3 and 12 months.
- Segment everything by property type, price band, and school zone.
- Select 3 to 6 tight comps within 0.25 to 0.5 miles and adjust for differences with a documented method.
- Check local factors like taxes, new development, infrastructure, and floodplain or insurance considerations.
- Revisit the analysis quarterly or any time you plan to list or make an offer.
Ready to move with confidence?
If you want a clear, tailored read on Rockville Centre’s numbers for your home or your target block, get a custom MLS report and pricing strategy session with Theresa Brown. You will get local segmentation, comps, and a step-by-step plan for listing, buying, or both.
FAQs
How fast do houses sell in Rockville Centre right now?
- Check median DOM for your specific property type and price band using recent MLS data over the last 3 months, and ask for cumulative DOM to avoid relist resets.
What happens if I list 5 percent below similar homes?
- You may draw more traffic and a quicker sale, especially in low-inventory segments, but results depend on inventory, demand in your price tier, and condition.
Do sale-to-list ratios include seller credits or concessions?
- No, the ratio compares sale price to list price and does not net out credits or closing costs, so review net proceeds when comparing offers.
How should I handle school zones when picking comps?
- Use comps within the same district or assignment zone because values often differ across boundaries, even within short distances.
Can mortgage rate changes shift the Rockville Centre metrics quickly?
- Yes, higher rates can reduce the qualified buyer pool and push inventory and DOM up while softening sale-to-list ratios; lower rates often have the opposite effect.